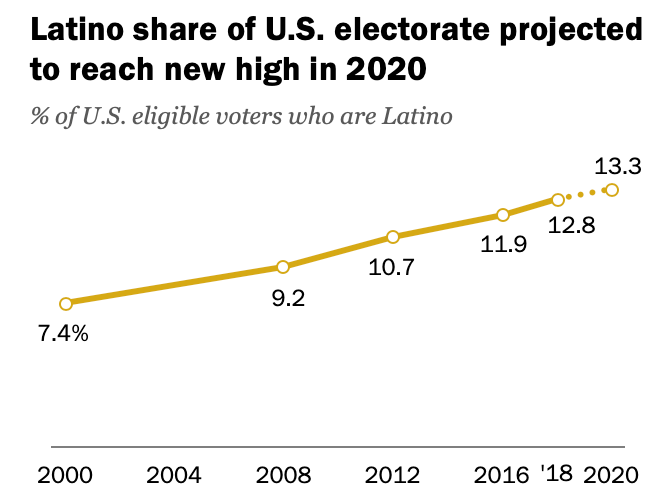
This year, 32 million Latinos are eligible to vote in the United States, making up 13.3% of the electorate. It is the first time that Latinos are expected to be the largest ethnic minority eligible to vote in a presidential election. Based on data by the Pew Research Center, we take a closer look at the Latino vote by the numbers.

The Latino vote is principally clustered into five states, where every two out of three Latinos resides. California alone, with 7.9 million Latino eligible voters, accounts for roughly one quarter of the country’s Latino electorate. Texas is the second state with the largest Latino electorate, with 5.6 million Latinos who are eligible to vote, followed by Florida (3.1 million), New York (2 million), and Arizona (1.2 million). This interactive map shows the number of eligible Latino voters by state.
Numbers are significant among both US-born and immigrant Latinos. Of all eligible Latino voters, about a quarter (7.5 million) are immigrants. Nationally, in 2018 Latinos accounted for 34% the immigrant electorate.
Latinos make up more than half of the pool of all eligible voters who are immigrants in states like Florida and California. In Florida, 54% of all eligible immigrant voters are Latino. From these numbers, 606,000 voters are Cuban immigrants, the largest group of Florida’s foreign-born electorate, 190,000 are Colombian, and 187,000 are Haitian. In Texas, 52% of all eligible immigrant voters are Latino, with Mexican immigrants accounting for 40% of all immigrant voters at 736,000 people. Nationally, immigrants from Mexico are also the largest group of foreign-born voters, making up 16% of the foreign-born electorate.
Counting both immigrant and US-born Latinos, Latinos make up huge shares of the total electorate in states like New Mexico (47%), California (30%), Texas (30%), Arizona (24%), and Florida (20%).
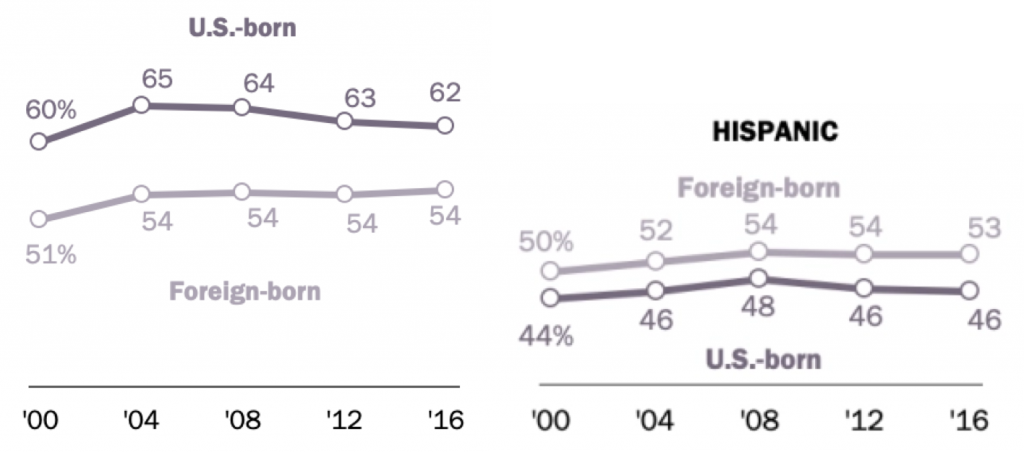
Voter turn-out rates among Latino immigrants is higher than other foreign-born groups. While voter turn-out for immigrants as a whole has lagged behind that of US-born voters, the pattern is reversed for Latinos. In 2016, 53% of eligible immigrant Latinos voted, versus 46% of the US-born, a pattern that has persisted since 2000.

And finally, though Latino immigrants turn out to vote in higher numbers than their foreign-born and US-born counterparts, only about half of the country’s 60 million Latinos are eligible to vote, the smallest share of any ethnic group. Many Latinos are too young to vote (18.6 million are under 18 years old), and others are non-citizens (11.3 million).
It is therefore the duty of all of us who are Latino eligible voters to turn out on election day or make plans to vote by mail or vote early. Our electorate’s numbers are significant, and we have the power to vote for issues that affect our entire communities, including those who are not eligible to vote.
IQLatino invites you to check out some of our resources and share them with your friends and family to make our vote count this November. You can find a Spanish guide to how and when to vote by state here, and a bilingual guide to electoral terminology here. Additionally, you can check whether you are registered to vote and your voting precinct here, and in Spanish here. If you have not already done so, you can register to vote here.
The Latino vote matters, let’s make our voices heard.
